Amplify your global influence
We are pioneers in AI-driven social technologies that revolutionize global audience engagement—empowering organizations to deliver unrivaled brand experiences through authentic, scalable solutions that define the social landscape through technology innovation.
Social Activation Engine
Brand Advocate
Integrate & automate faster
Advanced AI Integrations
Content creation
Ignite content creation at scale through the power of generative AI—embracing a new era of unparalleled innovation and human potential characterized by boundless creativity and efficiency.

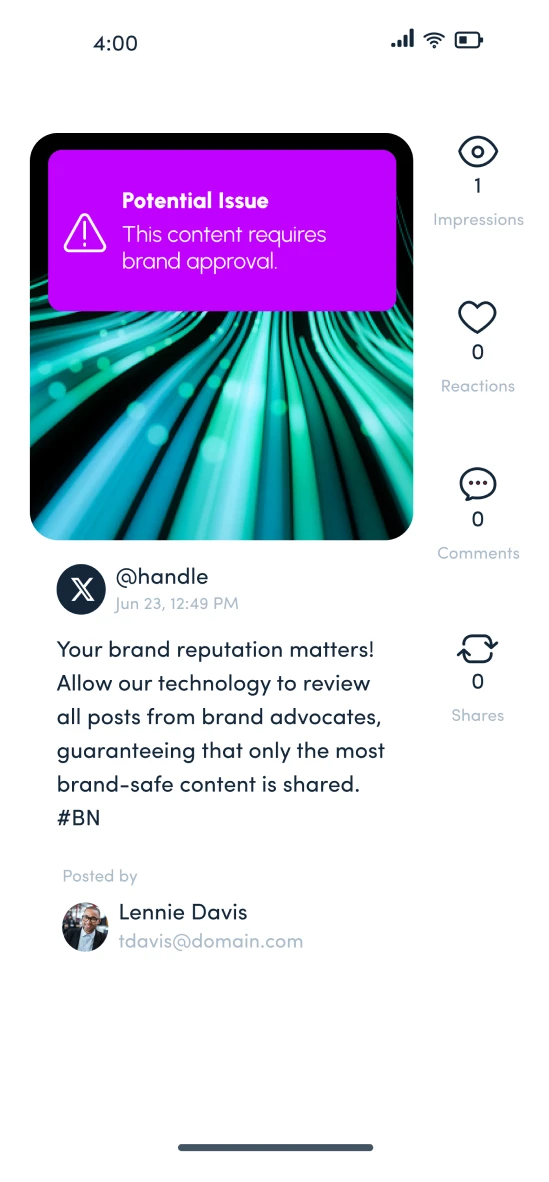
bnGuard™
Maintain brand compliance, adhere to regulatory requirements and prevent the release of unauthorized content from impacting your reputation with our proprietary content review system.
Open Signals
Supercharge advertising strategies with our global-leading AI rules engine that optimizes organic content in real time, refreshing dynamic ad creatives to build and strengthen social engagement.

Powering Social Transformation